Financial Highlights
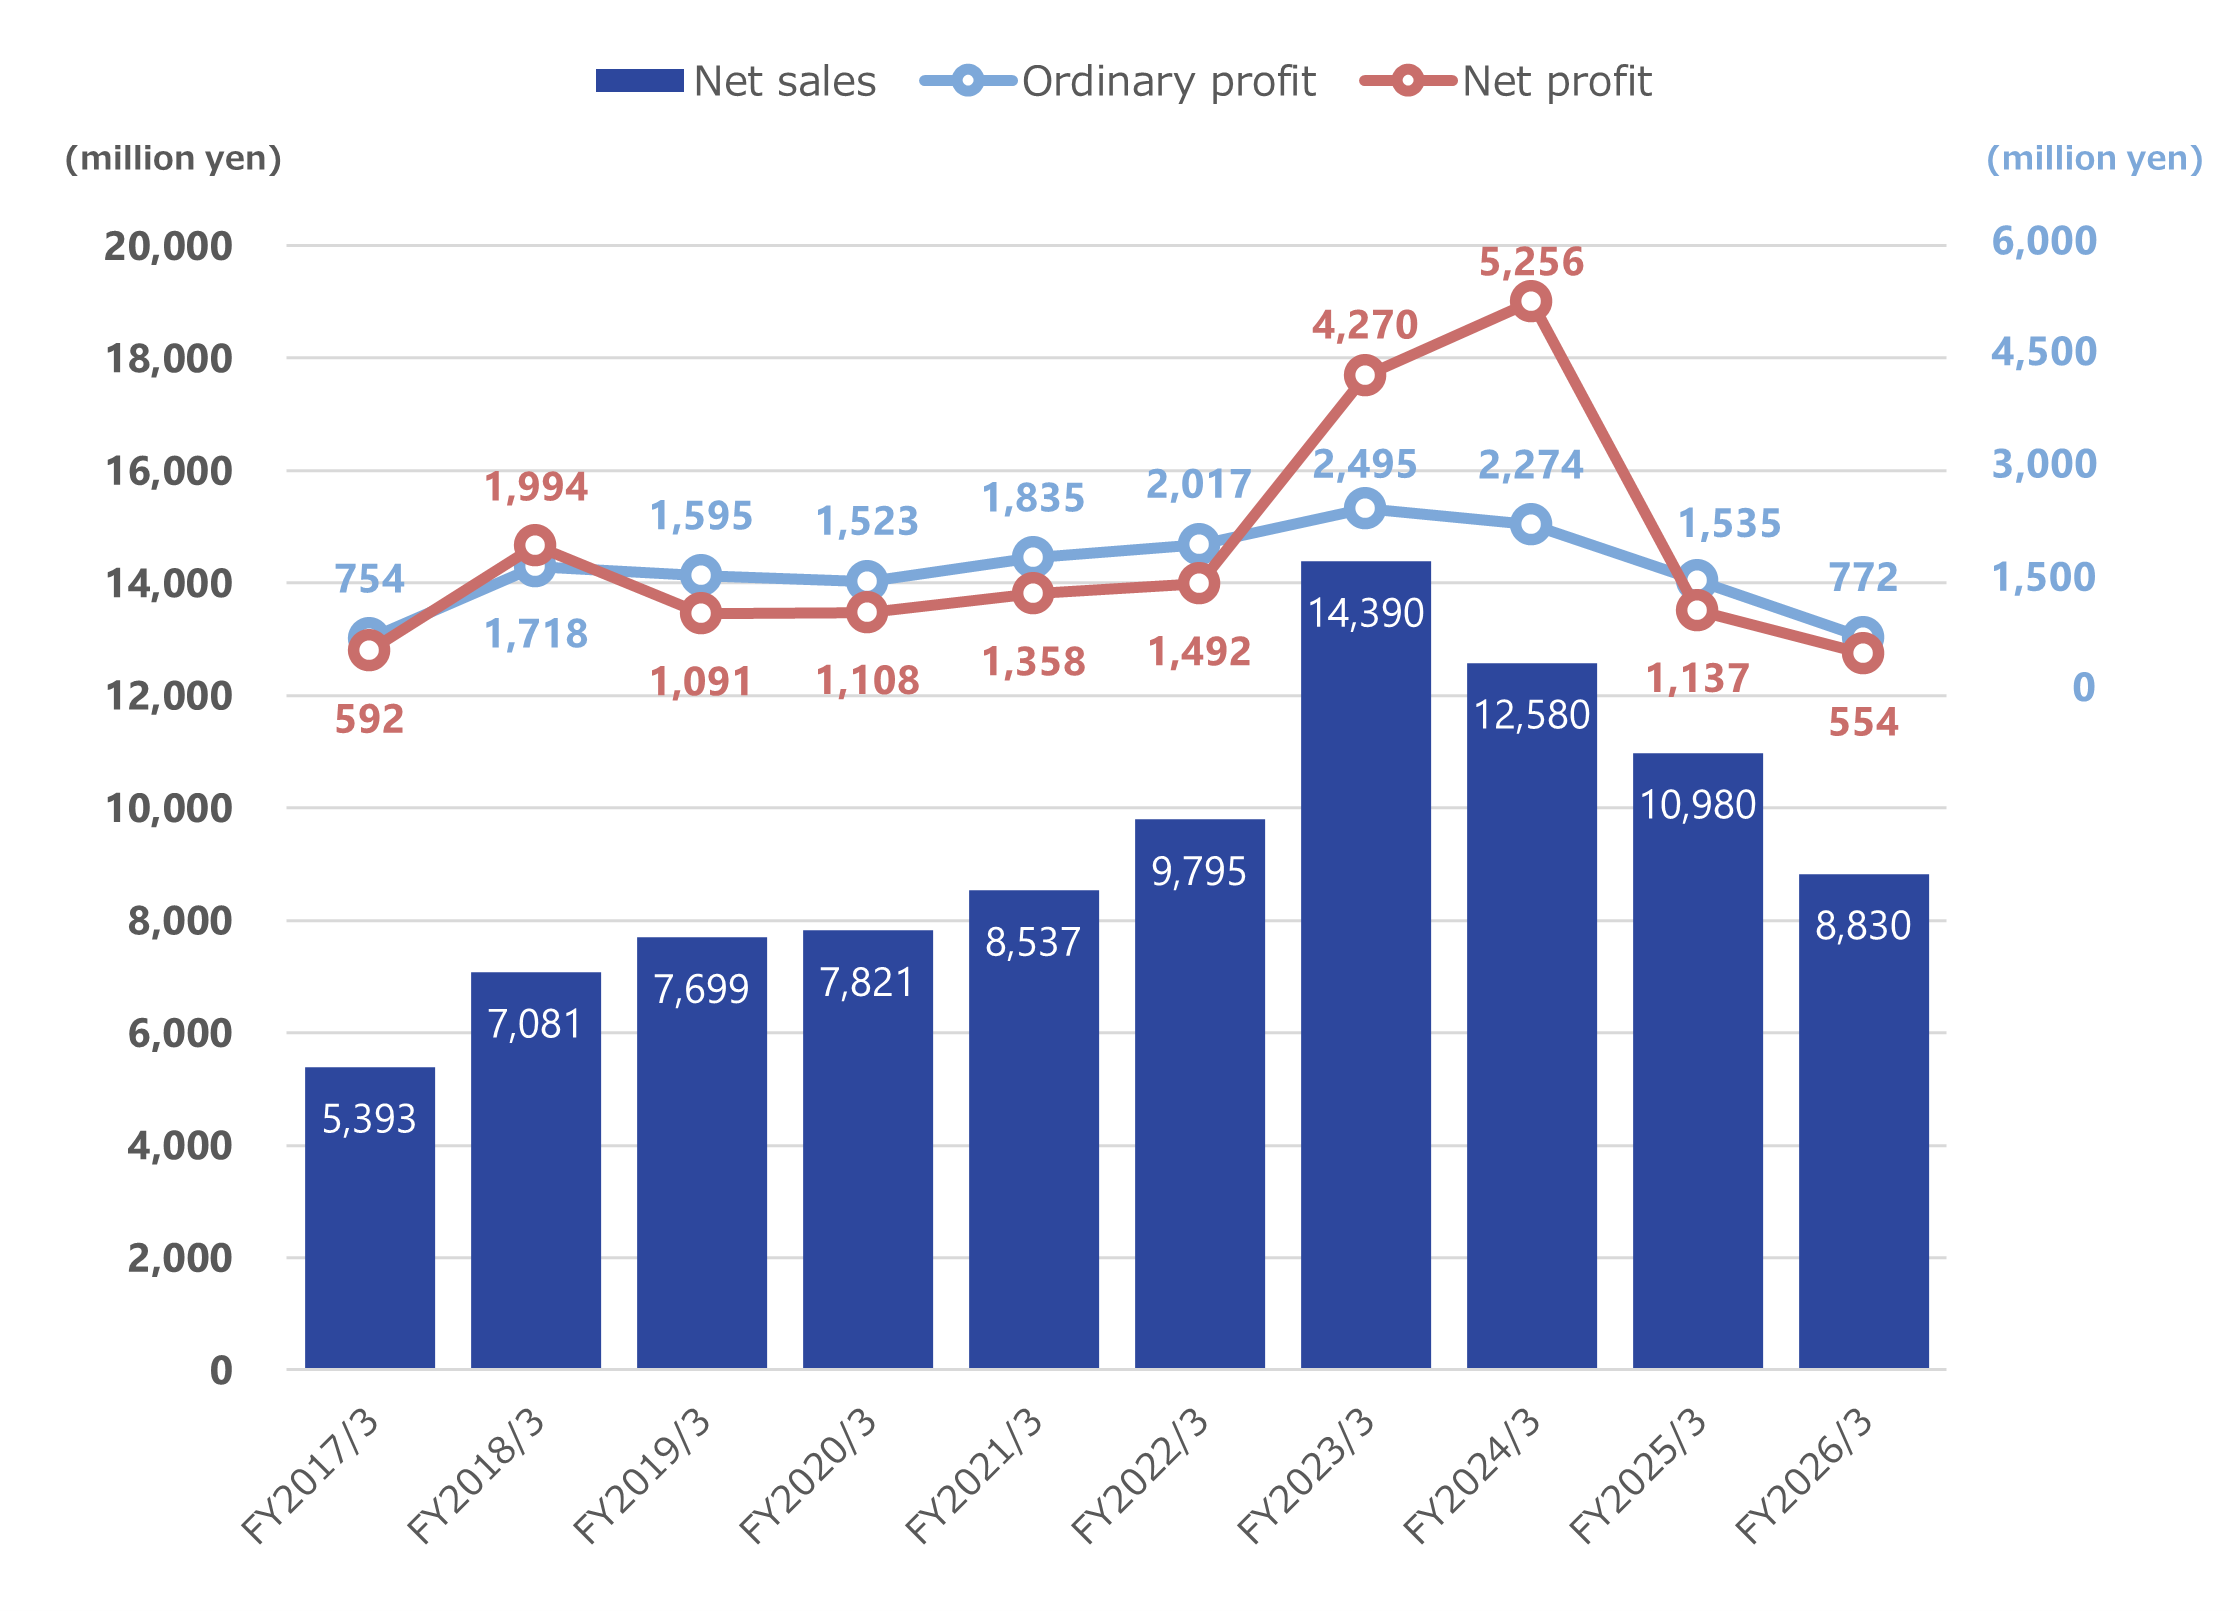
Changes in Financial Results
| (million yen) | |||
|---|---|---|---|
| FY | Net sales | Ordinary profit | Net profit |
| The 67th term April 2025–March 2026 | 8,830 | 772 | 554 |
| The 66th term April 2024–March 2025 | 10,980 | 1,535 | 1,137 |
| The 65th term April 2023–March 2024 | 12,580 | 2,274 | 5,256 |
| The 64th term April 2022–March 2023 | 14,390 | 2,495 | 4,270 |
| The 63th term April 2021–March 2022 | 9,795 | 2,017 | 1,492 |
| The 62th term April 2020–March 2021 | 8,537 | 1,835 | 1,358 |
| The 61th term April 2019–March 2020 | 7,821 | 1,523 | 1,108 |
| The 60th term April 2018–March 2019 | 7,699 | 1,595 | 1,091 |
| The 59th term April 2017–March 2018 | 7,081 | 1,718 | 1,994 |
| The 58th term April 2016–March 2017 | 5,393 | 754 | 592 |
Changes in financial results
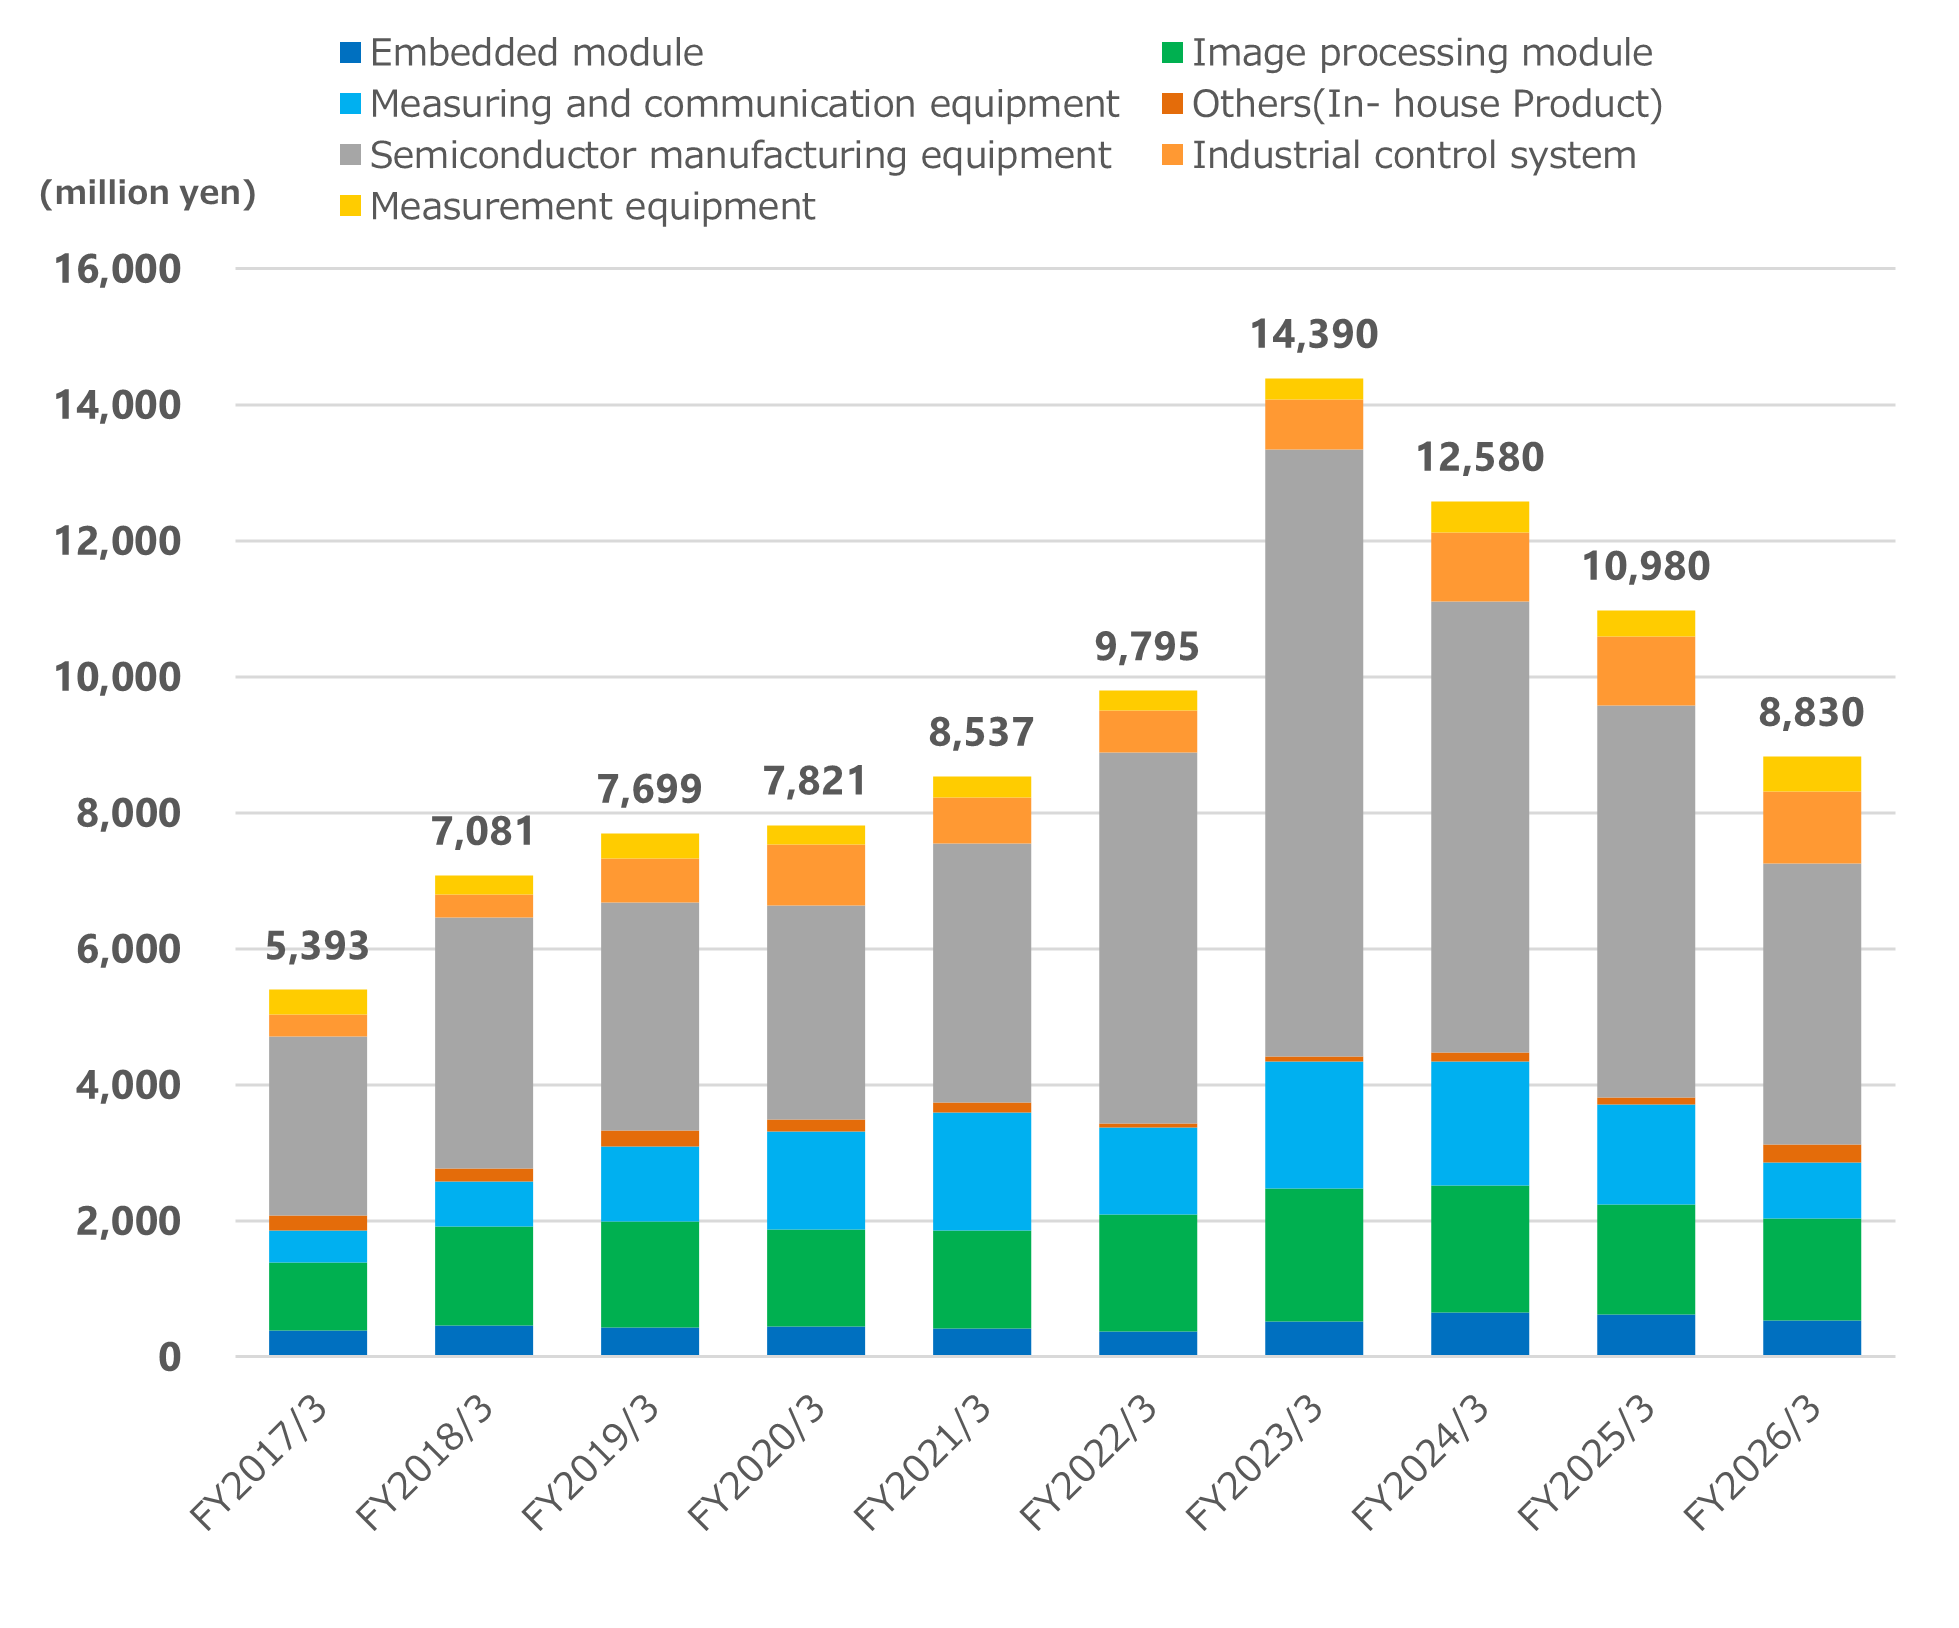
Net sales by product category
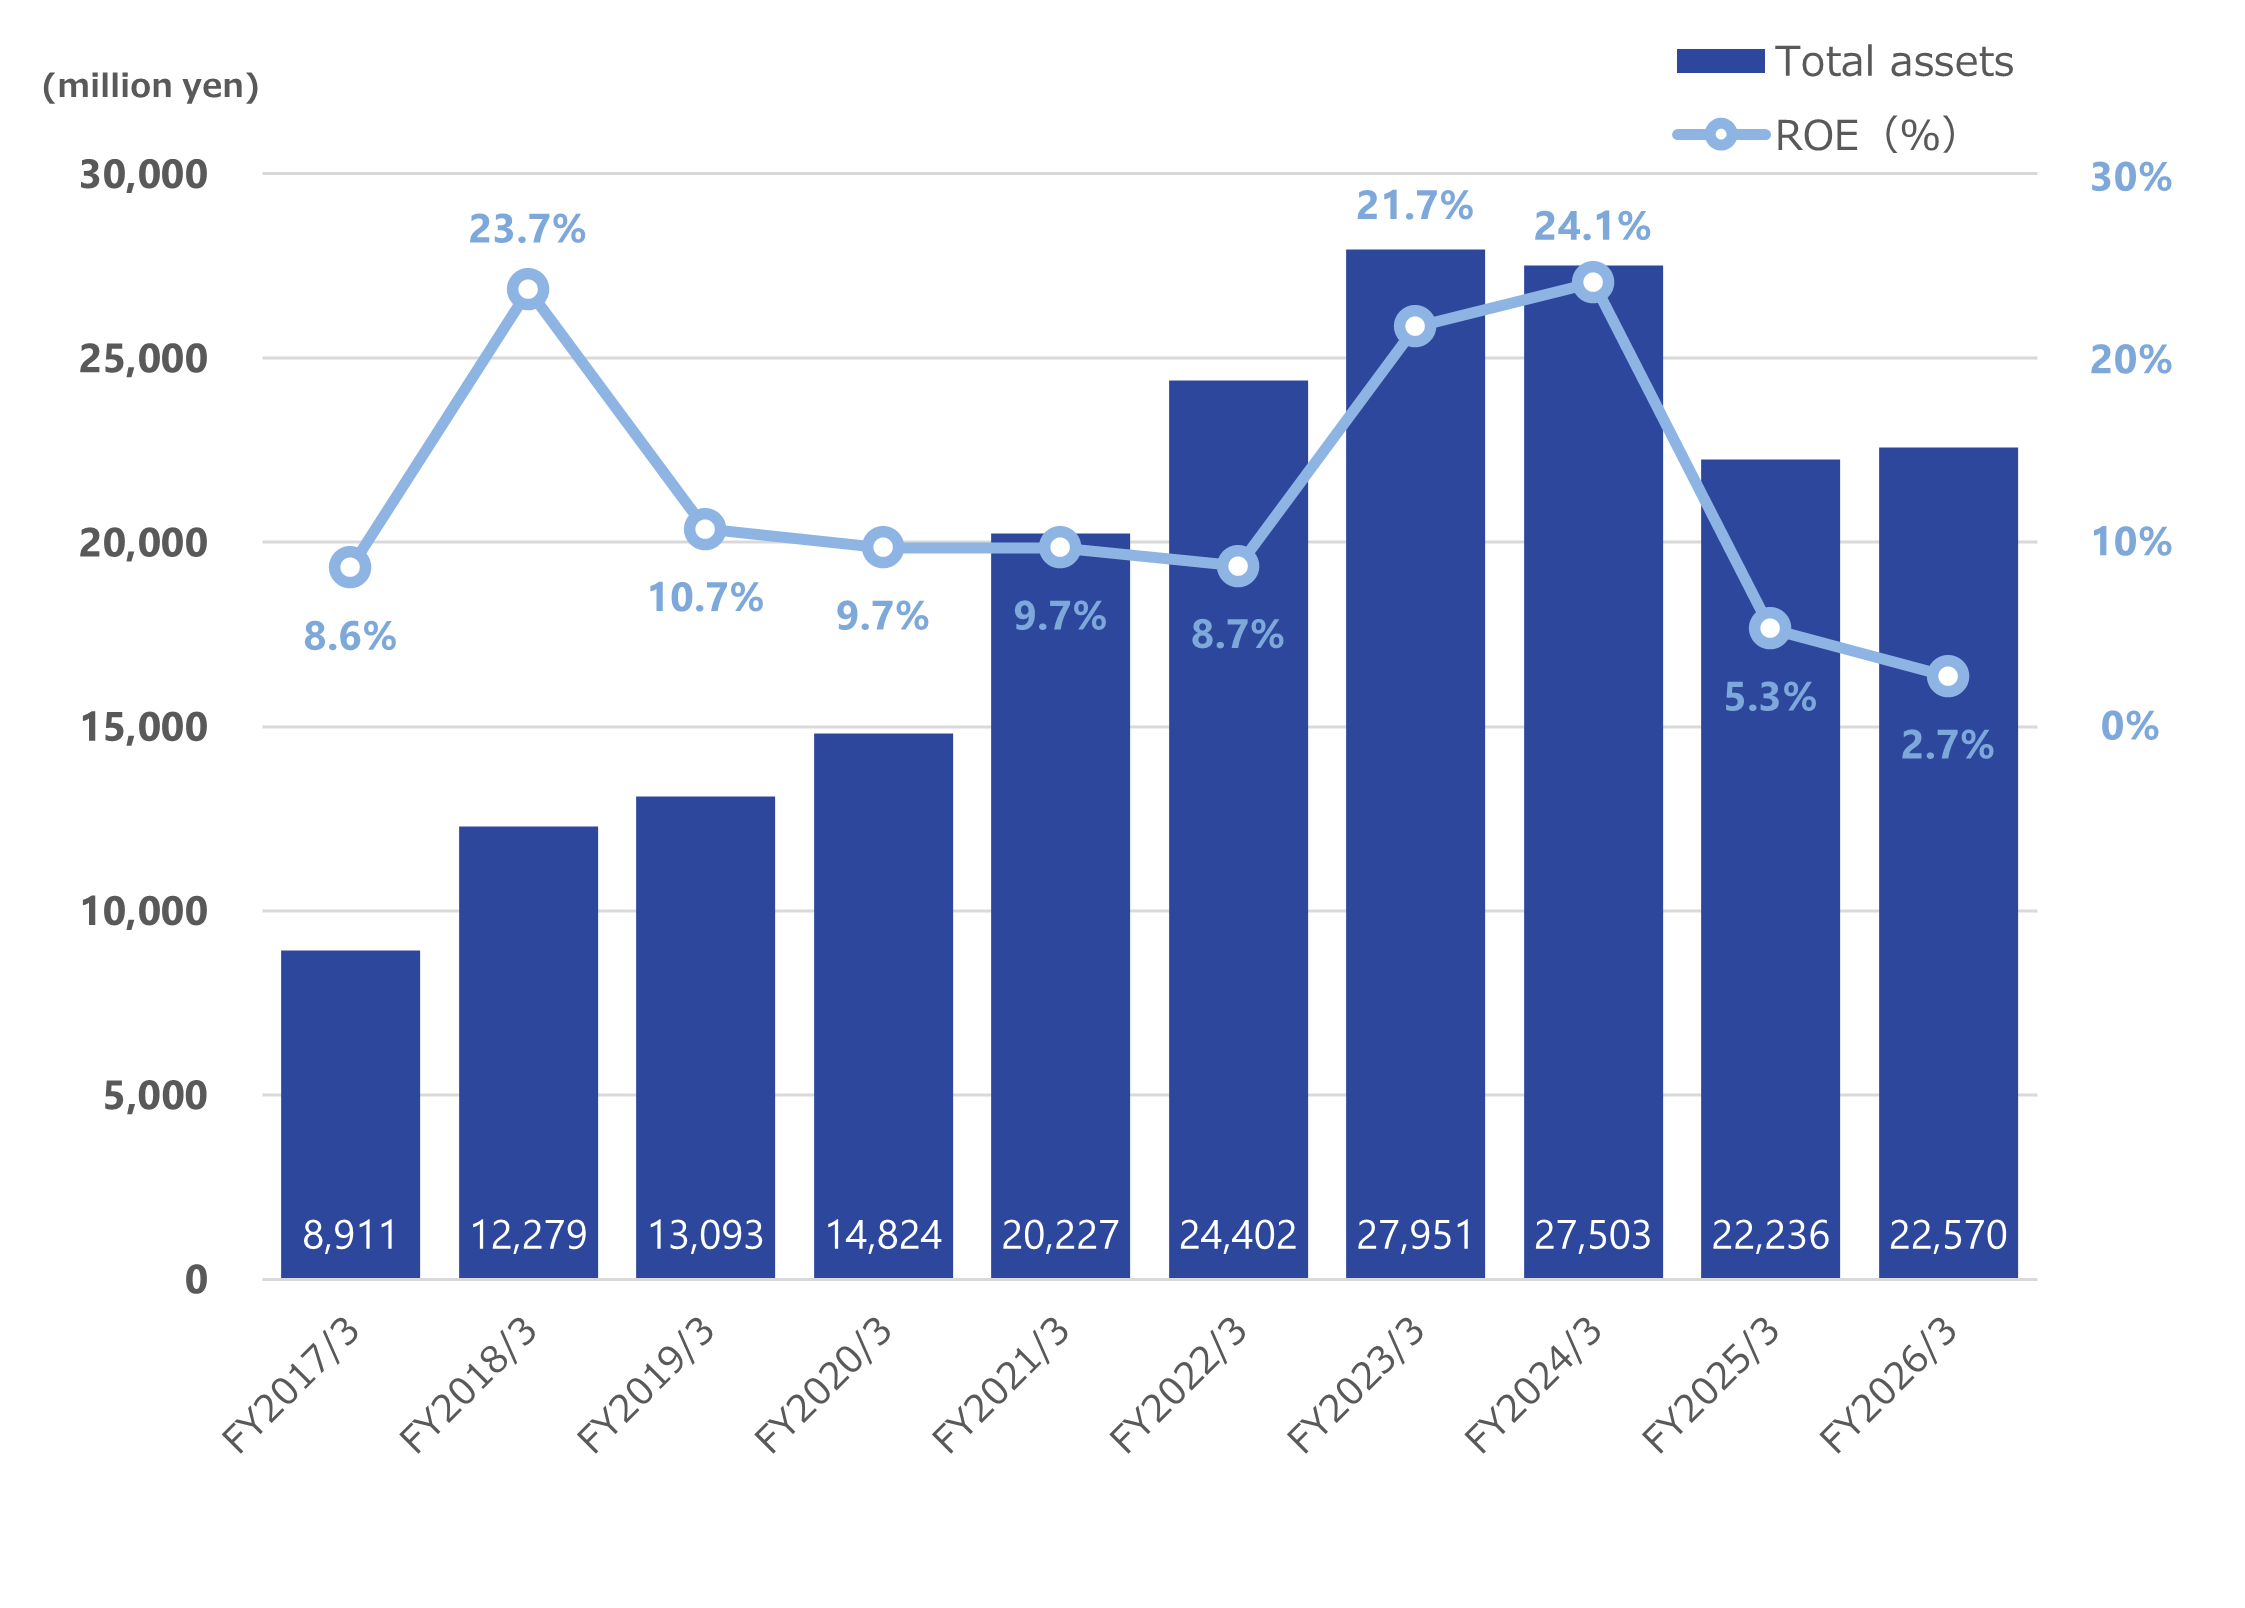
Changes in Total Assets and Return on Equity (ROE)
| (million yen) | ||
|---|---|---|
| FY | Total assets | ROE(%) |
| The 67th term April 2025–March 2026 | 22,570 | 2.7% |
| The 66th term April 2024–March 2025 | 22,236 | 5.3% |
| The 65th term April 2023–March 2024 | 27,503 | 24.1% |
| The 64th term April 2022–March 2023 | 27,951 | 21.7% |
| The 63th term April 2021–March 2022 | 24,402 | 8.7% |
| The 62th term April 2020–March 2021 | 20,227 | 9.7% |
| The 61th term April 2019–March 2020 | 14,824 | 9.7% |
| The 60th term April 2018–March 2019 | 13,093 | 10.7% |
| The 59th term April 2017–March 2018 | 12,279 | 23.7% |
| The 58th term April 2016–March 2017 | 8,911 | 8.6% |
Total assets and ROE
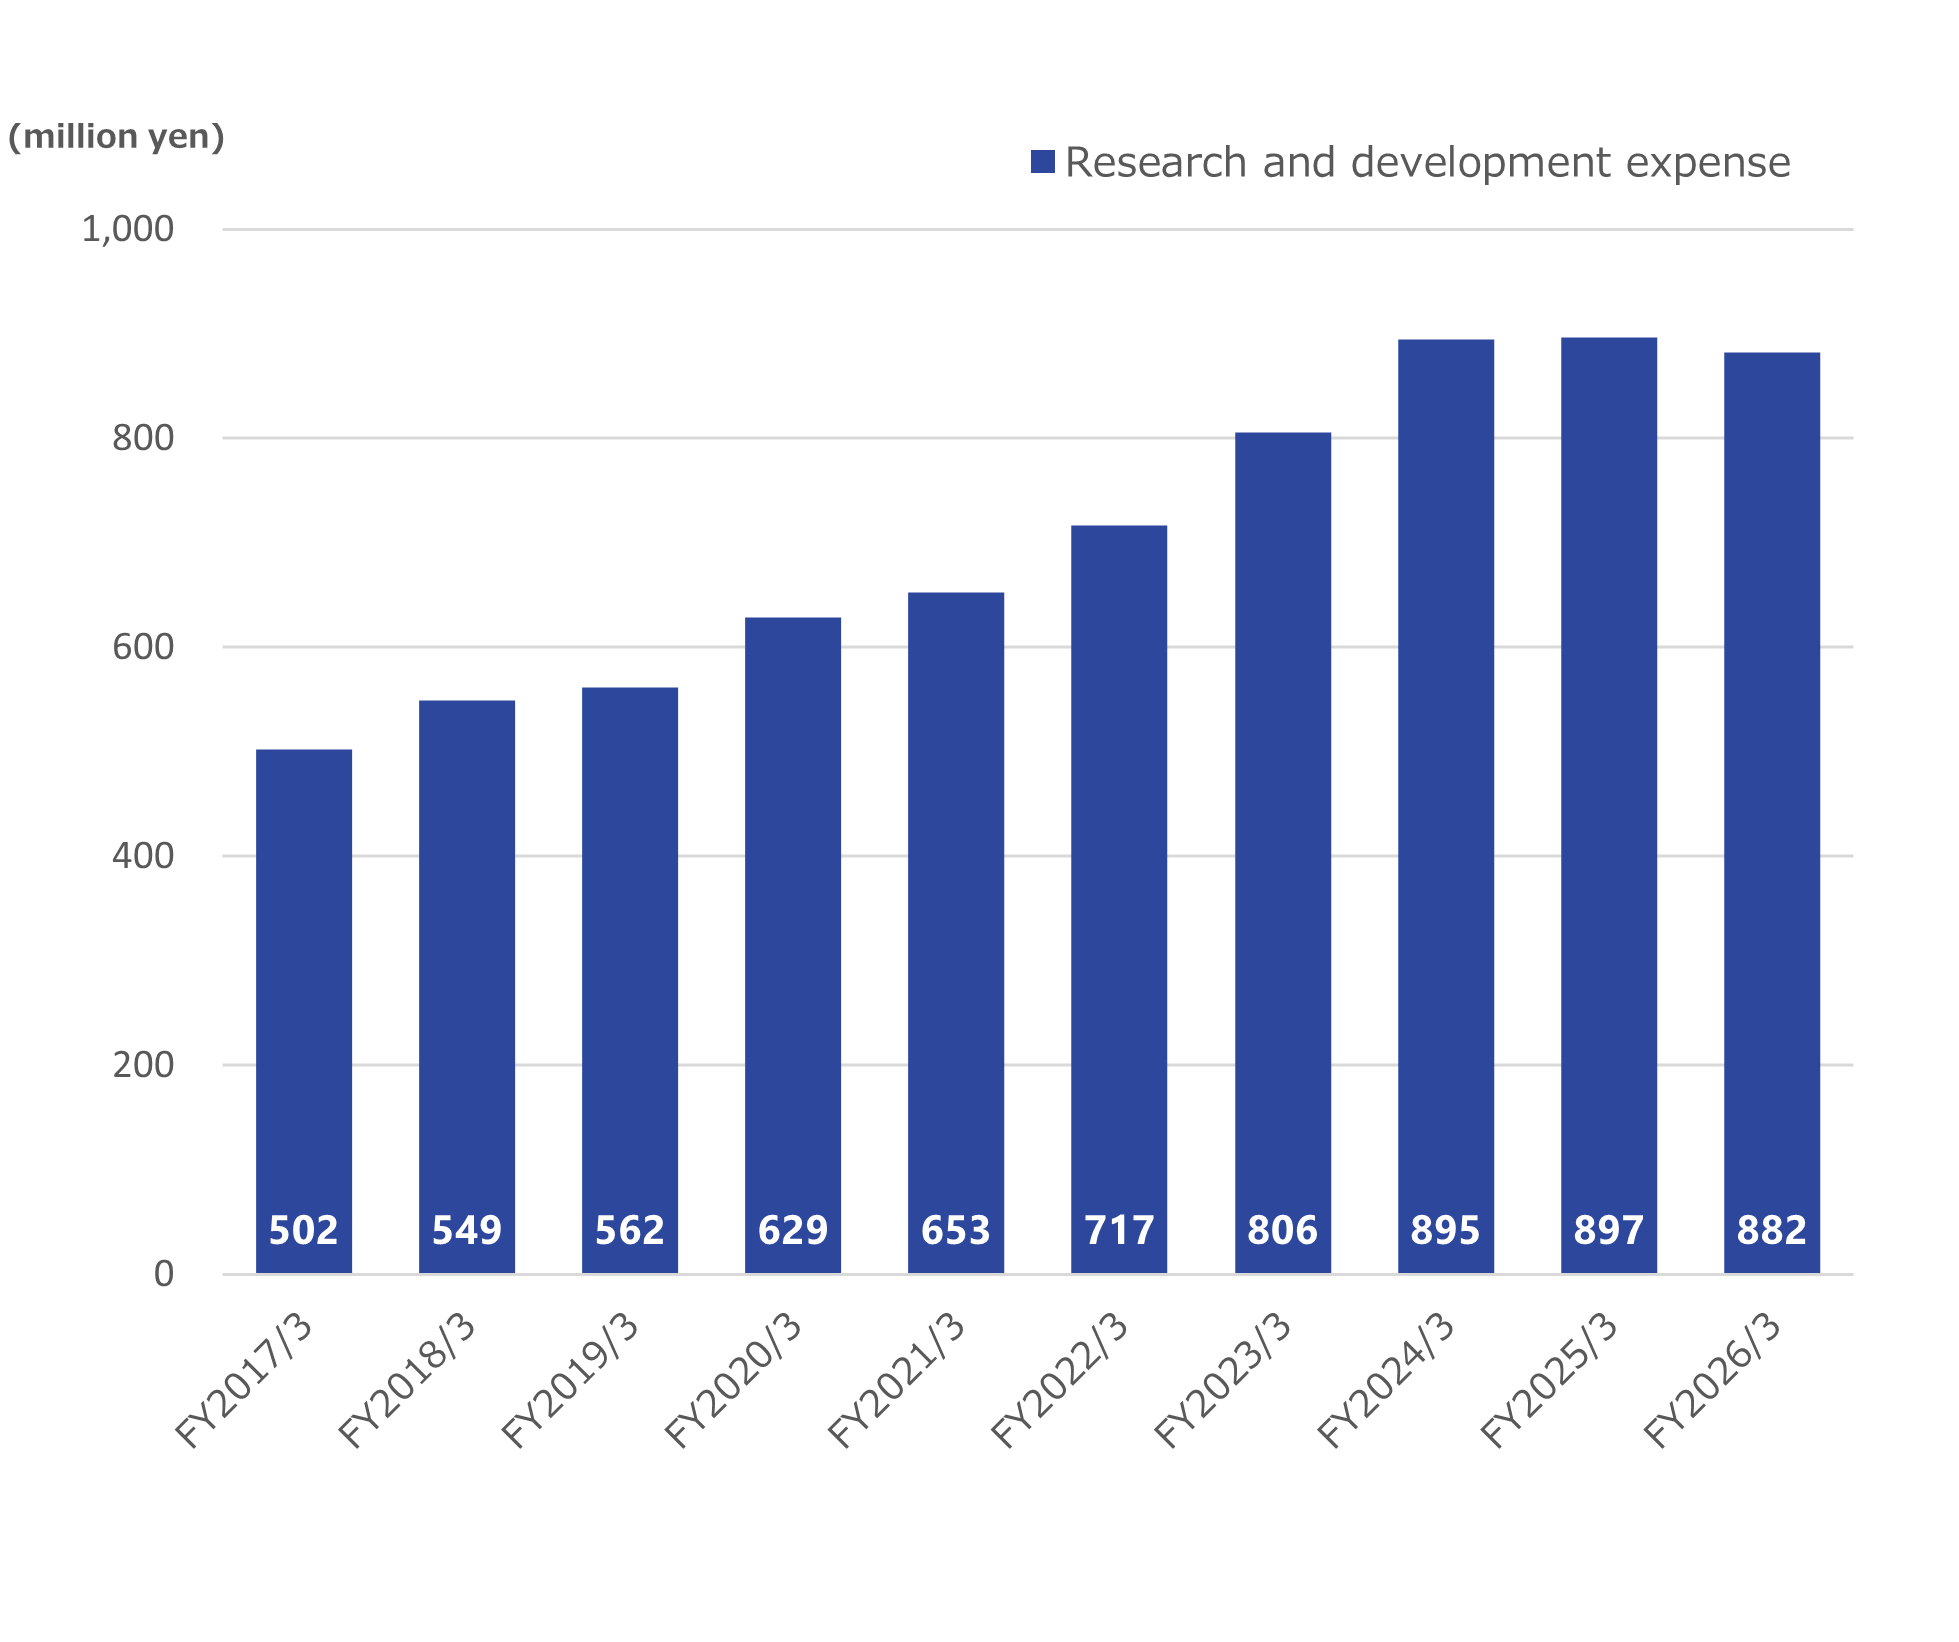
Changes in Research and Development Expenses
| (million yen) | |
|---|---|
| FY | Research and development expenses |
| The 67th term April 2025–March 2026 | 882 |
| The 66th term April 2024–March 2025 | 897 |
| The 65th term April 2023–March 2024 | 895 |
| The 64th term April 2022–March 2023 | 806 |
| The 63th term April 2021–March 2022 | 717 |
| The 62th term April 2020–March 2021 | 653 |
| The 61th term April 2019–March 2020 | 629 |
| The 60th term April 2018–March 2019 | 562 |
| The 59th term April 2017–March 2018 | 549 |
| The 58th term April 2016–March 2017 | 502 |
Research and development expenses
Copyright @ Avaldata Corporation. All rights reserved.